
This guide is for reps who sell solar to Ontario Class B accounts, commercial sites drawing 50 kW to 999 kW, and want to start quoting batteries. Each signal below takes one question or one file on the first call. Battery Proposal Studio does the analysis.
- ▸Request Green Button data from every prospect and upload it to Battery Proposal Studio. It plots the load and calculates the demand charge ratio.
- ▸A demand charge ratio above 35% makes the site a battery candidate. Above 50–60%, battery payback often beats solar alone.
- ▸If load displacement would curtail a net-meter-sized array, a battery stores the surplus and the full array earns the incentive.
- ▸Ask about outages. Studio simulates how many hours a battery holds the site, so you can size for the protection the client needs.
Three signals to look for
Demand charges
Demand charge ratio above 35%
Load displacement
Midday solar above site load
Backup
Repeat outages with a real cost
Look for high demand charge ratios
Solar cuts energy charges ($/kWh). Demand charges ($/kW) follow the site's highest peak in the billing period, which solar does little to move. A battery discharges into that peak. The larger the demand share of the bill, the stronger the battery case. Ontario demand charges have risen every year for five years, which our demand charge rate review covers in detail.
What the battery does to the peak
1.1Request Green Button data from every prospect
Ask for it on every call, solar or battery. It costs the client a download from their utility portal. Our smart-meter data guide has the steps for each utility and an email template you can send.
1.2Read the ratio in Battery Proposal Studio
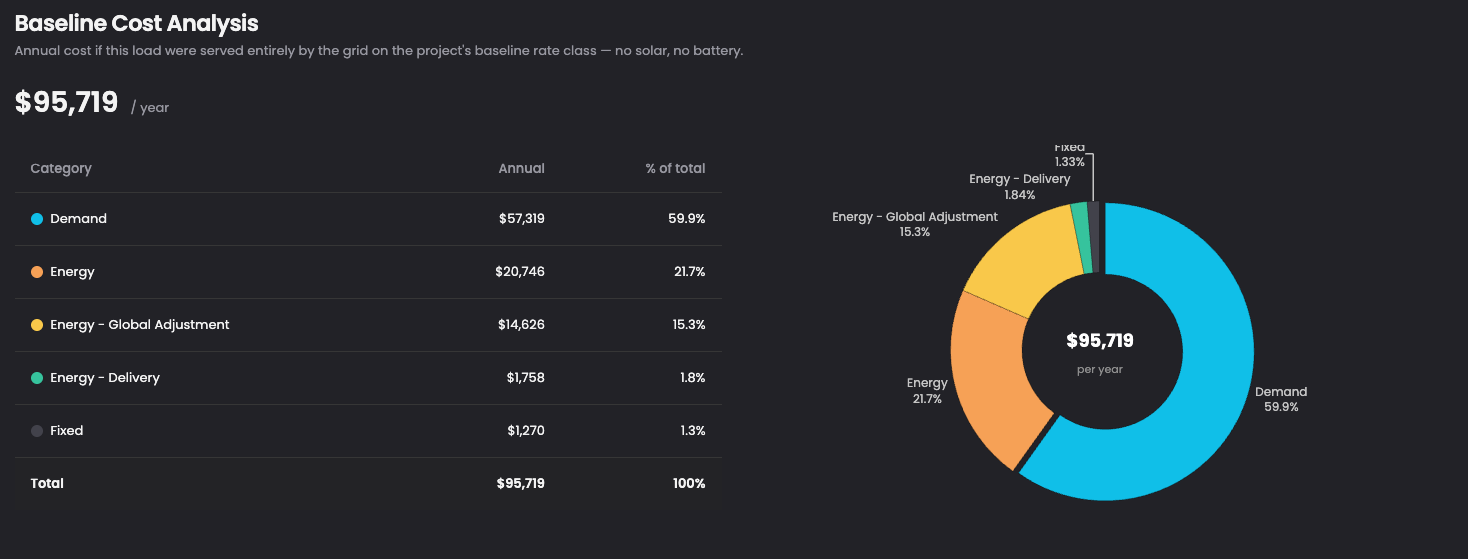
Upload the file to Studio and set the LDC and rate class. Studio plots the interval load and prices it on the site's rate class, then splits the annual cost into demand, energy, Global Adjustment, delivery and fixed charges. The demand share is your ratio. No spreadsheet.
1.3Screen the site
Above 35%, pair a battery with the solar quote. The site above sits at 59.9%, in the range where battery payback often beats solar alone.
Demand charge ratio = demand charges ÷ total bill
Below 35%
Solar leads.
35%+
Battery candidate.
50–60%+
Battery payback often beats solar alone.
Solar leads the quote. A battery can still earn its place through curtailed solar (section 02) or backup (section 03).
Combine battery with the load displacement incentive
The ideal solar plus battery project claims the load displacement capital incentive on a solar array that would curtail without a battery. The battery stores the midday surplus the site can't use, so the full array earns.
- 01Start at the net-meter size. Size the array the way you would for a net-metering quote.
- 02Convert to load displacement. Keep the array. Production above site load now curtails instead of crediting.
- 03Add the battery's value. Assess every value stream the battery brings on top of the incentive.
Load displacement, no battery
Load displacement + battery
Without a battery you shrink the array to avoid curtailment, or you keep it and waste the surplus. Either way the client loses incentive value. With a battery, the full array qualifies and the surplus displaces evening load.
- ▸Captured solar. Surplus midday production shifted into evening load.
- ▸Demand charge reduction. The same battery shaves the monthly peak (section 01).
- ▸Backup protection. Critical assets stay on through an outage (section 03).
Model it before you quote it. Upload the Green Button data to Battery Proposal Studio and compare solar alone against solar plus battery.
Learn to ask about backup
Solar buyers seldom raise outages on their own. Ask. The answers set the hours of protection, and Battery Proposal Studio sizes the battery to deliver them against the site's real load.
3.1Size it in Battery Proposal Studio
Upload the load and pick a battery size. Studio simulates outages across the year on the facility's interval data and plots how long the battery carries the site.
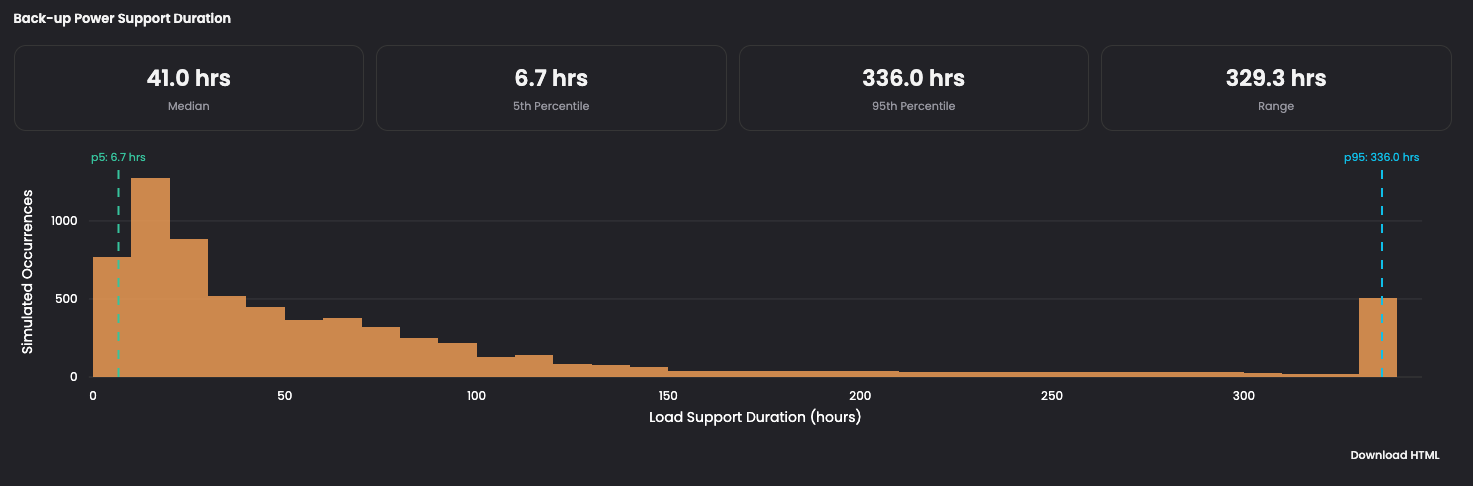
- ▸Read the 5th percentile as the floor. Compare it to the hours of protection the client asked for.
- ▸Short of the target? Change the battery size and rerun while the client is on the call.
3.2Rough math before the Studio
12 kW of critical load held for 4 hours needs about 48 kWh. Use it to sanity-check the Studio result.
3.3Where the backup case lands
Price the bad day
Rare but costly. Sell it as insurance.
Lead with backup
Frequent and costly.
A bonus
Lead with section 01 or 02.
Note it
Supports section 01 or 02.
One signal opens the conversation. Each added signal adds a value stream to the same battery and shortens payback. On every first call, request Green Button data, note the array size you would quote for net metering, and ask about outages and the assets that cannot go down.
Battery Proposal Studio
Got the Green Button file? Run the screen.
Upload your client's interval data, read the demand charge ratio, and size the battery for backup before you write the quote.